
Fixed income
Let's talk about quality
Back to all
Quality stocks: worth the hype or a pricey trap? Let's unravel their true potential.
Investing in stability
Quality stocks have always been a magnet for investors. After all, who wouldn't be tempted by the allure of top-tier stocks? Quality stocks are associated with solid investment performance and less downside risk. But isn't this in contrast to what we have all learned in our introductory investment or corporate finance courses: higher risk (beta) is associated with higher expected returns? The finance professional's equivalent to 'No pain, no gain'. Doesn't the general appeal of quality characteristics lead to higher valuations, impairing future returns?
Surely, there are times when quality stocks are not expected to perform particularly well, compared to, for instance, cheaper, more cyclically exposed stocks. When cyclical dynamics unexpectedly take a turn for the better, the latter group can show strong bursts of outperformance. But if predicting these cyclical shifts isn't your forte, might it be wiser to stay anchored in the quality segment? Or will you then become the victim of the stocks' potential overvaluation, the result of their attractiveness?
In this research article, we investigate quality stocks' long-run performance, the extent to which they offer downside protection, their valuations, and growth expectations.
What are quality stocks?
Quality is a broad and somewhat vague concept, but it is often associated with more concrete, quantifiable attributes such as higher profitability, lower debt, and an overall lower cyclicality. All these attributes imply greater defensiveness. In a way, we could thus argue that these metrics are the fundamental equivalents of screening for lower volatility. Similarly, we could argue that screening for lower volatility is a more direct way to screen for defensiveness, compared to the more indirect way of screening for higher profitability or lower debt. In this article, we will put high profitability (return-on-equity), low leverage (or a high equity ratio), and low volatility (stock price volatility) side by side.
Returns for global quality stocks
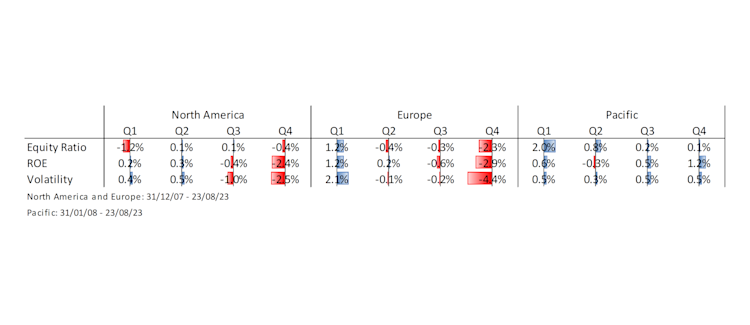
The table below shows the annualised excess performance for roughly the last 15 years, for two fundamental quality metrics – equity ratio and return-on-equity – and a price-derived quality metric – volatility. Their performance is tracked in the three different regions that are part of the MSCI Developed Market indices: North America, Europe, and the Pacific.
The first thing that stands out is that in North America and Europe, it has especially been beneficial to avoid low-quality stocks. As for high-quality stocks, their excess returns have not been particularly positive in North America, but they have been in Europe. This might be explained by the fact that this has been a more turbulent period for Europe than for North America.
It's different for the Pacific. In that region, the three quality metrics appear, on average, not to differentiate much in terms of accumulated return over this period [1].
Figure 1: Excess returns
Source: DPAM, 2023
In any case, the results are in contrast with the mantra 'high risk, high reward'. They confirm the sound practice for investors to avoid the riskiest stocks. In the academic literature, the relatively good returns of low-volatility stocks, compared to high-volatility stocks, have been referred to as the low volatility anomaly.
Risk for global quality stocks
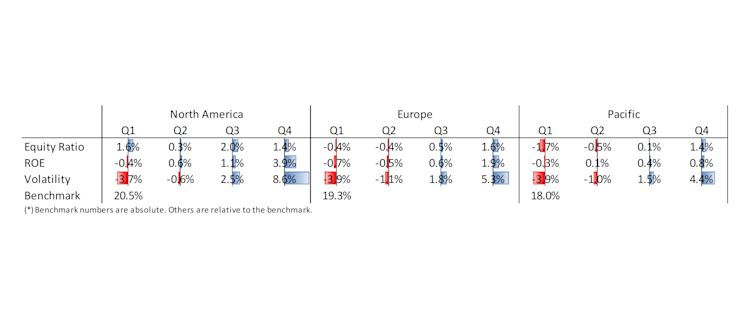
The tables below show the annualised volatility relative to the benchmark, for the same three quality metrics. As can be expected, low-quality stocks have a volatility that exceeds the benchmark's volatility. This is the case for the three different quality metrics and across the three different geographical regions.
High-quality stocks have a volatility that is generally below the benchmark's volatility. However, as expected, screening for volatility has the most direct link with realised portfolio return volatility. In the US, there is a spread of c. 12% between the volatility of a portfolio holding stocks with relatively low historical stock price volatility and one holding stocks with relatively high historical stock price volatility. Importantly, both portfolios are constructed to hold identical sector weights.
The table demonstrates what is written above: screening for low volatility is the most direct way to screen for defensiveness. It generates more defensive portfolios than screening for high profitability or low leverage.
Figure 2: Volatility relative to benchmark
Source: DPAM, 2023
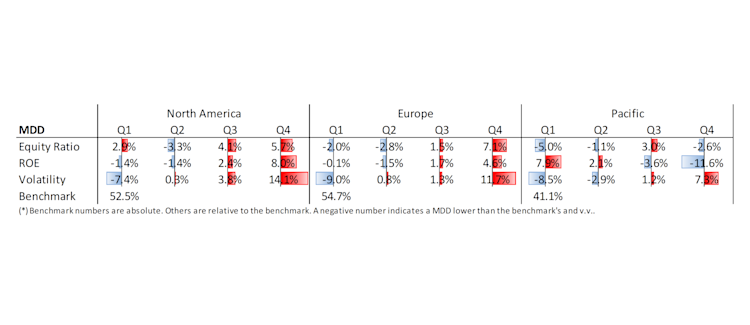
It can be argued that volatility may not necessarily be the best metric for defensiveness. After all, volatility includes upside volatility as well. So, let’s investigate the investment strategies’ maximum drawdown relative to the benchmark’s maximum drawdown. This can be seen in the table below. The defensiveness of quality stocks again stands out, with Pacific high profitability stocks being the notable exception. Again, screening for low volatility appears the most direct way to a defensive portfolio.
Figure 3: Maximum drawdown relative to benchmark
Source: DPAM, 2023
The results are confirmed by investigating the average loss in calendar months with negative returns. Focusing on months with negative returns, the average returns for the three regional portfolios with low volatility stocks are on average 60-70bps less negative than the negative monthly returns for their respective regional benchmarks (numbers not shown here).
Valuation for global quality stocks
As quality characteristics are generally attractive to investors, we might expect that on average, quality stocks likely command higher valuations. Their good relative performance compared to lower quality stocks further raises the suspicion that quality stocks could be expensive. Before showing the numbers, we first note that two dynamics can mitigate these conclusions. Firstly, as these portfolios are regularly rebalanced, the selection of quality stocks regularly changes. Secondly, a stock’s valuation is also influenced by its fundamentals. If earnings grow more favourably for high-quality stocks than for low-quality stocks, this will benefit the evolution of their relative valuation.
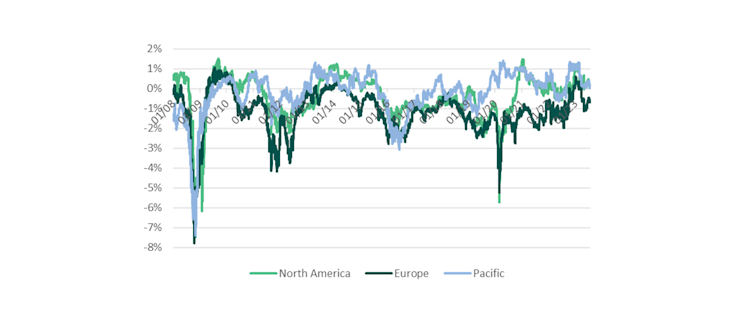
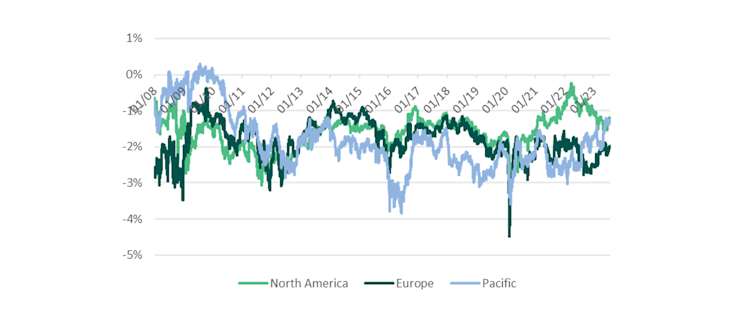
The graph below shows the difference in earnings yield for low volatility stocks and high volatility stocks. If this number is negative, it means the earnings yield for low volatility stocks is lower than the earnings yield for high volatility stocks, in other words, that they are more expensive. We can quickly see that in economically turbulent times, low volatility stocks tend to become significantly more expensive than high volatility stocks.
As expected, across the entire period, there has been on average a valuation premium for defensive stocks relative to their riskier peers. The valuation premium for low volatility stocks has on average been the most significant in Europe, followed by the US and finally in the Pacific, with average relative earnings yields of respectively -1.15%, -0.42%, and -0.20%.
Current valuations for low volatility stocks are neither particularly expensive nor cheap. This is in line with the current environment with an uninspiring macro context and contained equity market volatility.
Figure 4: EY difference – low versus high volatility stocks
Source: DPAM, 2023
The graph below shows the difference in earnings yield for high equity ratio stocks versus low equity ratio stocks, with a negative number indicating a more expensive valuation for companies with a stronger balance sheet. Clearly, there is a strong tendency for these more robust companies to be priced more expensively.
Figure 5: EY difference – low versus high equity ratio stocks
Source: DPAM, 2023
Growth expectations for global quality stocks
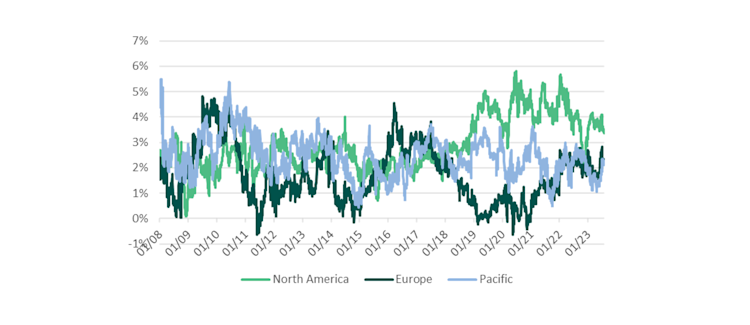
More expensive valuations are typically accompanied by higher growth expectations. If companies with stronger balance sheets are on average pricier than those with weaker balance sheets - as shown above - are their growth expectations also rosier? It turns out that this is the case, as visible in the graph below. This means that screening for stocks with a strong balance sheet will yield quality growth stocks. Will we find the same results for the other two quality metrics?
Figure 6: Sales growth difference – low versus high equity ratio stocks
Source: DPAM, 2023
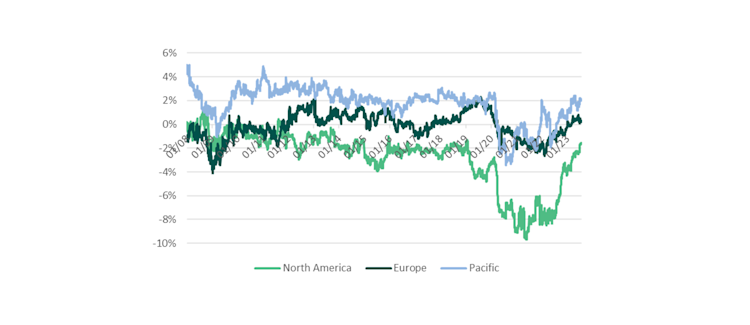
Screening for high return-on-equity stocks will not give you the same growth bias, except in the Pacific. In Europe, high ROE stocks have similar growth expectations to low ROE stocks. In North America, we really see the rise and fall of 'non-profitable growth' in the chart below. It shows that low ROE stocks have had higher growth expectations than high ROE stocks. While the surge in non-profitable growth has deflated over the last year, we can still see that growth and profitability - measured by ROE - do not go hand in hand in North America.
Figure 7: Sales growth difference – low versus high ROE stocks
Source: DPAM, 2023
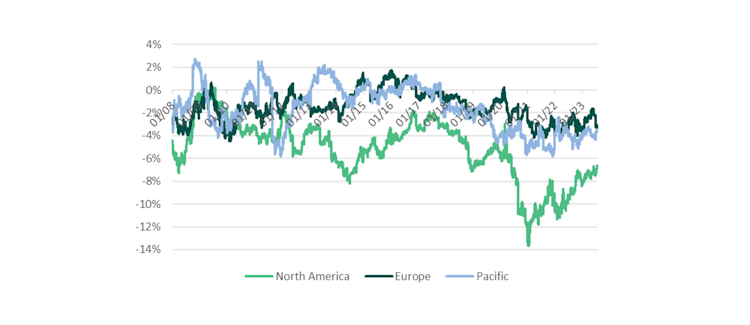
Finally, we investigate the growth expectations of low volatility stocks. The graph below confirms the perception of more mundane, less attractive, lower-growth companies belonging to the low volatility segment, compared to the high volatility segment. The positive relationship between volatility and growth stocks has intensified in North America with the rise in non-profitable growth. Rising yields have also been cited as a catalyst for growth stocks becoming more volatile. Note that in the graph, a negative number means that low volatility stocks have lower growth expectations than high volatility stocks.
Figure 8: Sales growth difference – low versus high volatility stocks
Source: DPAM, 2023
Conclusion
In this article we have analyzed the returns, risk and fundamentals for high- and low-quality stocks around the globe. One observation we have made is that avoiding weak balance sheets, weak profitability and high stock price volatility has added value in Western equity markets over the last 15 years. Screening for the opposite: strong balance sheets, strong profitability and low stock price volatility typically has led to more defensive portfolios, without really sacrificing returns. Especially the track record for low volatility stocks has been impressive.
Valuation-wise, we have observed that companies with strong balance sheets are typically more expensive. This does not only seem a valuation premium as a reward for their defensiveness, but also for better growth prospects on average. Low volatility stocks on the other hand are also more expensive than their high volatility counterparts, but this seems essentially a reward for their stability. Their growth prospects are on average lower than the growth prospects for high volatility stocks. Especially in North America, this is remarkable.
The results are coherent with low profitability companies having better growth prospects in North America, compared to high profitability companies. This is still the case today, even if the rise of non-profitable growth in the North American stock market has deflated. We can thus conclude that the link between quality and growth, depends on the quality metric that is chosen. The relationship between growth and balance sheet strength is positive, while it is negative with stock price volatility. For return-on-equity, it depends on the region: the relationship is on average positive in the Pacific, flat in Europe and negative in North America.
[1] Note that due to the portfolios’ weighting schemes being different than the benchmark’s market cap weighting, it is possible that all quartiles do better than the benchmark. This likely means that mid caps outperformed large caps over this period.
Avis de non-responsabilité
Communication marketing. Investir comporte des risques.
Les points de vue et opinions contenus dans le présent document sont ceux des personnes à qui ils sont attribués et ne représentent pas nécessairement les points de vue exprimés ou reflétés dans d'autres communications, stratégies ou fonds de DPAM.
Les informations fournies dans le présent document doivent être considérées comme ayant un caractère général et ne prétendent en aucun cas être adaptées à votre situation personnelle. Son contenu ne constitue pas un conseil en investissement, ni une offre, une sollicitation, une recommandation ou une invitation à acheter, vendre, souscrire ou effectuer toute autre transaction sur des instruments financiers. Ce document ne constitue pas non plus une recherche en investissement ou une analyse financière indépendante ou objective ou une autre forme de recommandation générale sur la transaction en instruments financiers telle que visée à l'article 2, 2°, 5 de la loi du 25 octobre 2016 relative à l'accès à la fourniture de services d'investissement et au statut et au contrôle des sociétés de gestion de portefeuille et des conseillers en investissement. Les informations contenues dans le présent document ne doivent donc pas être considérées comme une recherche indépendante ou objective en matière d'investissement.
Investir comporte des risques. Les performances passées ne garantissent pas les résultats futurs. Toutes les opinions et estimations financières reflètent la situation au moment de l'émission et peuvent être modifiées sans préavis. L'évolution des circonstances du marché peut rendre les opinions et les déclarations incorrecte.